Savills Vietnam releases property index in Ho Chi MInh City May 2013
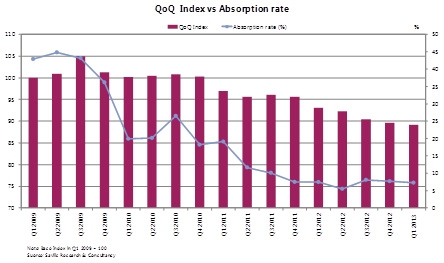
The majority of projects that had price reductions still had sluggish performance.
“Although there is strong supply, the absorption rate this quarter remained stable due to the improved number of sold units. The number of sold units increased 2 per cent QoQ and 25 per cent YoY. The ‘sold’ volume has been trending upward for three consecutive quarters,” it cited.
Since the base period of early 2009, the average market price including new projects has decreased by approximately -22 per cent whilst the index, which is calculated on the constant project basket only decreased by -11 index points.
“This shows that the downtrend in the average price is mainly due to the lower price of newly launched projects rather than price adjustment of existing projects,” according to Savills’ press release.
Although the downward trend of the residential price index continued this quarter, the rate is slowing. Combined with the significant improvement in transaction volume, a gradual market recovery and more stabilisation might be expected in the near term, it continued.

Figure 1: Residential QoQ Index vs Absorption rate
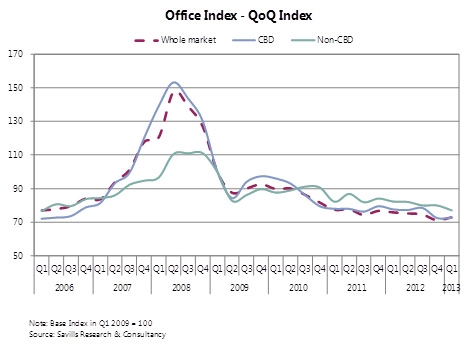
Regarding the index in office segment, the consultant said that the QoQ office index rose sharply in 2006, peaked in the second quarter of 2008 and then dropped sharply during the two latter quarters of the same year. Since 2010, the market has been in a downward trend.
The office index in the first quarter of 2013 stood at 73, an increase of 1.7 index points QoQ.
“Despite a slight decrease in average market rent, increased occupancy this quarter has helped to bring up the index,” it commented.
The CBD area performed better than the non-CBD in terms of both rent and occupancy. As a result, the CBD index rose slightly by one index point QoQ whilst non-CBD decreased by -3 index points.
Along with improvement in the index, market take-up also had substantial increase of 173 per cent QoQ and 70 per cent YoY.
“These are very positive indicators for a more stable and improving performance of the office market in the upcoming quarters,” it cited.

Figure 2: Office QoQ Index
What the stars mean:
★ Poor ★ ★ Promising ★★★ Good ★★★★ Very good ★★★★★ Exceptional
Latest News
More News
- Sun Group led consortium selected as investor for new urban area (February 06, 2026 | 15:20)
- Vietnam breaks into Top 10 countries and regions for LEED outside the US (February 05, 2026 | 17:56)
- Fairmont opens first Vietnam property in Hanoi (February 04, 2026 | 16:09)
- Real estate investment trusts pivotal for long-term success (February 02, 2026 | 11:09)
- Dong Nai experiences shifting expectations and new industrial cycle (January 28, 2026 | 09:00)
- An Phat 5 Industrial Park targets ESG-driven investors in Hai Phong (January 26, 2026 | 08:30)
- Decree opens incentives for green urban development (January 24, 2026 | 11:18)
- Public investment is reshaping real estate’s role in Vietnam (January 21, 2026 | 10:04)
- Ho Chi Minh City seeks investor to revive Binh Quoi–Thanh Da project (January 19, 2026 | 11:58)
- Sun Group launches construction of Rach Chiec sports complex (January 16, 2026 | 16:17)


 Mobile Version