R&D footprint in 2015 comes to air
The Study came from Strategy &, PwC’s strategy consulting business, which uniquely examined the R&D footprint of 207 of the world’s largest corporate R&D spenders.
Specifically, robust growth in China and India had driven Asia’s growth, recording increases of 79 per cent and 116 per cent, between 2007 and 2015, in imported spend, respectively, as more R&D moves into these regions mainly from the US.
“Asia taking the lead as the top destination for corporate R&D is not surprising when you look at where companies are spending their R&D dollars to support their revenue growth goals – a prime indicator of how R&D is trending globally – and how much of R&D is headed to the Asia region,” says Barry Jaruzelski, a US firm principal with Strategy& as well as the study’s creator and lead-author.
The study finds that Europe’s fall to the third largest region for corporate R&D spend is a result of low growth in domestic and imported R&D, coupled with a substantial rise in exported R&D – particularly from France and Germany.
Comparatively, Europe’s domestic R&D spend growth has risen just 2 per cent between 2007 and 2015, compared to gains of 40 per cent in North America and 60 per cent in Asia. At the same time, European countries have increased their R&D allocation to high-cost offshore countries in North America and Asia, but not to near-shore Western Europe.
According to this year’s results, the US remains the largest spender of in-country corporate R&D, with in-country (domestic & imported) R&D spend at $145 billion in 2015, up 34 per cent since 2007.
Imported R&D spend to the US, mostly coming from Europe, in 2015 is $53 billion, up 23 per cent from 2007; meanwhile exported R&D spend in 2015 is $121 billion, up 51 per cent from 2007, predominantly going to Asia where previously in 2007 it was going to Europe.
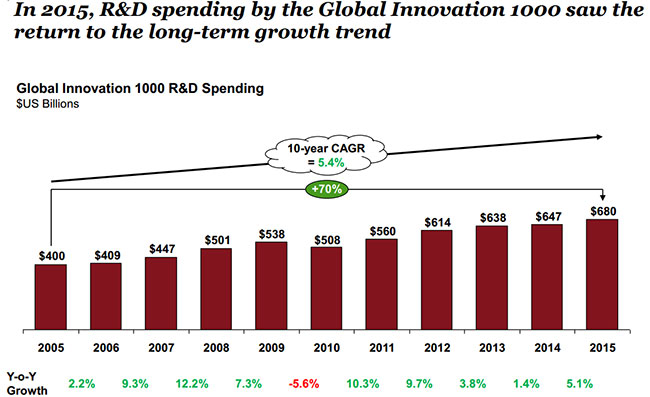
In addition, Strategy&’s annual analysis of the world’s 1000 largest R&D spenders also found R&D had returned to its long-term growth trend post-financial crisis.
Accordingly, in 2015, R&D spend by the Global Innovation 1000 has increased 5.1 per cent to $680 billion, the largest year-over-year increase within the last three years.
The three largest industries for R&D Spend in 2015 are computing and electronics (C&E), healthcare and auto.
Meanwhile, the software & Internet industry has the highest growth rate of 27 per cent of all the industries between 2014 and 2015, pushing it past the industrials sector to become the fourth largest industry by R&D spend in 2015.
Global innovation professionals have ranked Apple, Google, and Tesla as the three most innovative companies in the world, with Tesla jumping to third place from fifth in 2014.
As it has in each of the past 10 editions of the Global Innovation 1000, this year Strategy& identified the 1,000 public companies around the world that spent the most on R&D during the last fiscal year, as of June 30, 2015.
The Global Innovation 1000 companies collectively account for 40 per cent of the entire world’s R&D spending, from all sources, including corporate and government sources.
What the stars mean:
★ Poor ★ ★ Promising ★★★ Good ★★★★ Very good ★★★★★ Exceptional
Latest News
More News
- State corporations poised to drive 2026 growth (February 03, 2026 | 13:58)
- Why high-tech talent will define Vietnam’s growth (February 02, 2026 | 10:47)
- FMCG resilience amid varying storms (February 02, 2026 | 10:00)
- Customs reforms strengthen business confidence, support trade growth (February 01, 2026 | 08:20)
- Vietnam and US to launch sixth trade negotiation round (January 30, 2026 | 15:19)
- Digital publishing emerges as key growth driver in Vietnam (January 30, 2026 | 10:59)
- EVN signs key contract for Tri An hydropower expansion (January 30, 2026 | 10:57)
- Vietnam to lead trade growth in ASEAN (January 29, 2026 | 15:08)
- Carlsberg Vietnam delivers Lunar New Year support in central region (January 28, 2026 | 17:19)
- TikTok penalised $35,000 in Vietnam for consumer protection violations (January 28, 2026 | 17:15)






 Mobile Version