Data modelling to revamp transportation for agriculture supply chains in Vietnam
In Vietnam, the ability to transport products to markets in a timely and reliable manner has always been a major challenge in agriculture and food systems, largely because of the country’s underdeveloped infrastructure and long supply chains. These weaknesses in transport and logistics that connect food to markets are further exposed when pandemics, floods, and other natural disasters happen, dramatically increasing logistics and transport costs. The emergence of the agrifood sector as a crucial economic driver has also further exposed this delicacy – with growing demand for the timely delivery of high-quality products for growing domestic and export markets. If not addressed, these gaps will continue to impact farmers’ livelihoods and hinder national economic development.
The Commonwealth Scientific and Industrial Research Organisation (CSIRO) and its in-country partners are resolved to understand and map the complex movements of agricultural products in Vietnam. Our goal is to create a knowledge base and provide advice to industry, government, and investors on increasing efficiency and improving the resilience and reliability of supply chains.
Through the “Enhancing smallholder linkages to markets by optimising transport and logistics infrastructure” project supported by the Australian Centre for International Agricultural Research (ACIAR), we applied a combination of methods: key informant interviews and direct observations in the field, stakeholder consultations, secondary data compilation and analysis, statistical and geographic information system analyses, and optimisation modelling.
We adapted TraNSIT to map the supply chains and test different scenarios for associated impacts. TraNSIT was developed in Australia where it is used with industry and government to reduce costs, support investment decisions, and optimise supply chains to improve market access to domestic and export markets.
In Vietnam, the research focused on Son La province in the northwest of Vietnam. Son La was chosen because it is an important agricultural hub for maize, cassava, sugarcane, and higher-value products such as fruit, vegetables, coffee, tea, and dairy. It is relatively remote, with limited road infrastructure creating challenges for connecting agricultural products and rural populations (including ethnic people) to markets and services.
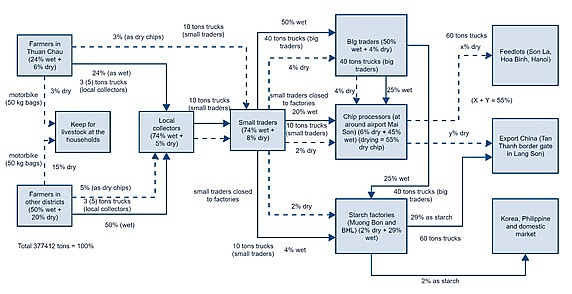 |
| Cassava supply chain map in Son La province |
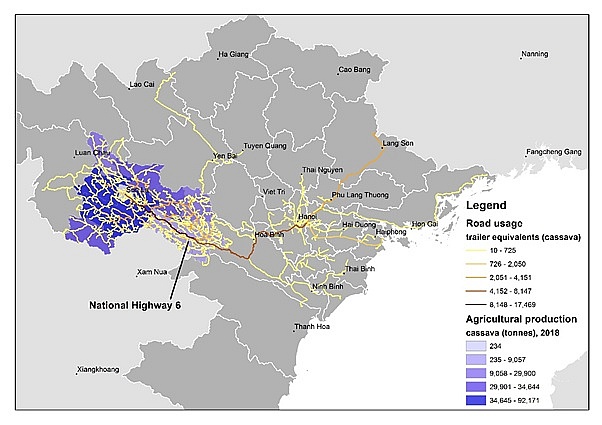 |
| Cassava production and road usage for the Son La province supply chain |
Key findings
Supply chain mapping to find choke points and constraints
We mapped the movement of most moved commodities: sugarcane; maize; cassava; coffee; and vegetables in Son La. The production was concentrated in Mai Son district, with over 600,000 tonnes of exported agricultural commodities. For each item, we described detailed supply chains maps, with cassava shown in Figure 1.
The project answered important questions: Where are the choke points and network constraints causing inefficiencies? Where is the network overused and the supply chain vulnerable? And what is the cost of transporting agricultural products, and who is paying?
Figure 2 shows the cassava production by districts in Son La and the simulated road usage (in 20-tonne truck equivalents) that transports cassava from farms via traders to processing facilities and then to export markets. The map highlights a convergence of road usage into processing facilities and the outbound transport of starch and chips along the National Highway No.6 to the border gates near Lang Son to China.
Combining the cassava supply chain with other key commodities exported from the region reveals the intensity and extent of road usage. This shows the heavy reliance on the National Highway No.6 between Mai Son district and Hoa Binh town as the main link to end markets. Aggregated production (of cassava, maize, sugarcane, and coffee) at a district level (Mai Son and Moc Chau) is shown in Figure 3, which shows the density of truck traffic particularly around the Coi Noi trading and processing hub. Highlighted in Figure 3 (in yellow) are lower-class road segments with very high usage. These segments are likely to be freight bottlenecks and could be targeted for road network upgrades to enhance all-weather access, use by larger trucks, or increased average speeds.
The transport cost for the main commodities was $17.6 million per annum, with 62 per cent of those between farm and trader, 26 per cent between trader and processing factory, and 12 per cent post-processing. The high proportion of costs further upstream in supply chains is typical, especially in supply chains characterised by scattered small-scale production in remote locations, as found in Son La.
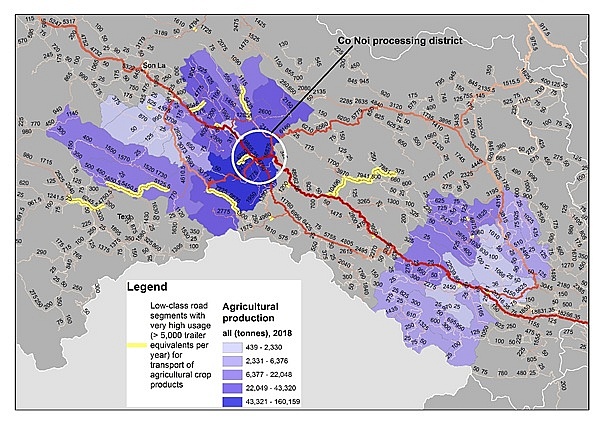 |
| All production and road usage for all mapped supply chains |
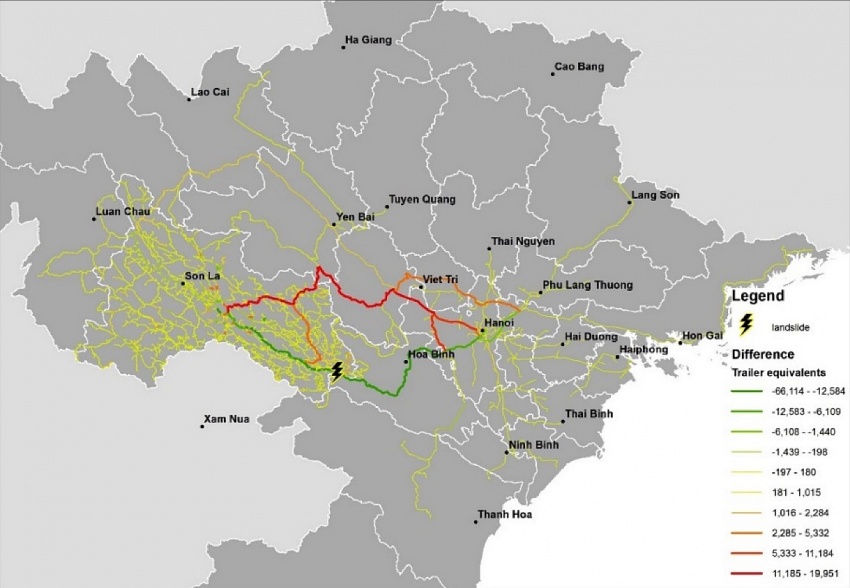 |
| Difference in road usage (before/after) in Son La province for landslide scenario |
Scenario testing to measure impacts
With a comprehensive understanding of the key commodities supply chains, we then examined the impact of disruptions and the effectiveness of infrastructure investment to improve connectivity. The results from the scenario examining a hypothetical landslide are outlined here.
Localised flash flooding and landslides are regular occurrences throughout Son La province each year and cause significant damage and prolonged closures to roads, and loss of agricultural land. This causes direct transport-related costs through delays, congestion from road damage and subsequent repairs and the additional time and distance associated with finding alternative routes. Road segments in the landslide area were modified so trucks could not pass, forcing an alternative route.
Figure 4 shows the differences in vehicle movements after the landslide, highlighting increasing (red) and decreasing (green) freight density. The simulated impact of the landslide is an annualised AUD1.2 million ($899,830) increase in transport costs due to re-routing. Most of these costs (63 per cent) are from traders to factories, 36 per cent incurred between factory and destination markets. There is little impact on transport costs from farms to traders. In this example, we explored the impact of one landslide on transport costs. A more comprehensive analysis could better account for total costs by including other agricultural and non-agricultural products and passenger transport and compare impacts for multiple sites at risk of landslide.
Conclusion
The project demonstrated how spatial data analytics and optimisation modelling could be applied to real-life transport modelling and investment planning. The TraNSIT model was successfully applied to Son La in Vietnam, showing the technical feasibility of applying it to real-life case studies, such as assessing the impacts of natural disasters.
Through a new, 2-year project being undertaken through the Australia-Vietnam Enhanced Economic Engagement Grant Pilot Program of the Department of Foreign Affairs and Trade, we are extending the work. This aims to support Vietnam’s efforts for digital transformation in the transport sector. TraNSIT and Vietnam’s Commercial Vehicle Tracking System (CVTS) will be used to analyse potential bottlenecks in export supply chains important to both countries, thereby aiming to transform connectivity in the agriculture, transport, and logistics sectors in Vietnam, with benefits for Australian trade.
(*) ACIAR Project team includes Chris Chilcott, Caroline Bruce, Adam McKeown, Rodd Dyer, Le Nga, and Le Huu Huan.
What the stars mean:
★ Poor ★ ★ Promising ★★★ Good ★★★★ Very good ★★★★★ Exceptional
 Tag:
Tag:
Related Contents
Latest News
More News
- Hermes joins Long Thanh cargo terminal development (February 04, 2026 | 15:59)
- SCG enhances production and distribution in Vietnam (February 04, 2026 | 08:00)
- UNIVACCO strengthens Asia expansion with Vietnam facility (February 03, 2026 | 08:00)
- Cai Mep Ha Port project wins approval with $1.95bn investment (February 02, 2026 | 16:17)
- Repositioning Vietnam in Asia’s manufacturing race (February 02, 2026 | 16:00)
- Manufacturing growth remains solid in early 2026 (February 02, 2026 | 15:28)
- Navigating venture capital trends across the continent (February 02, 2026 | 14:00)
- Motivations to achieve high growth (February 02, 2026 | 11:00)
- Capacity and regulations among British areas of expertise in IFCs (February 02, 2026 | 09:09)
- Transition underway in German investment across Vietnam (February 02, 2026 | 08:00)




 Mobile Version