GEP Index: North American Manufacturers Slow Amid Tariffs, Asia Ramps Up Output
CLARK, N.J., April 10, 2025 /PRNewswire/ -- GEP Global Supply Chain Volatility Index — a leading indicator tracking demand conditions, shortages, transportation costs, inventories, and backlogs based on a monthly survey of 27,000 businesses — decreased for a third successive month in March to -0.51 and posted its lowest value in almost five years, indicating the highest degree of spare capacity across global supply chains since the height of the COVID-19 pandemic in 2020.

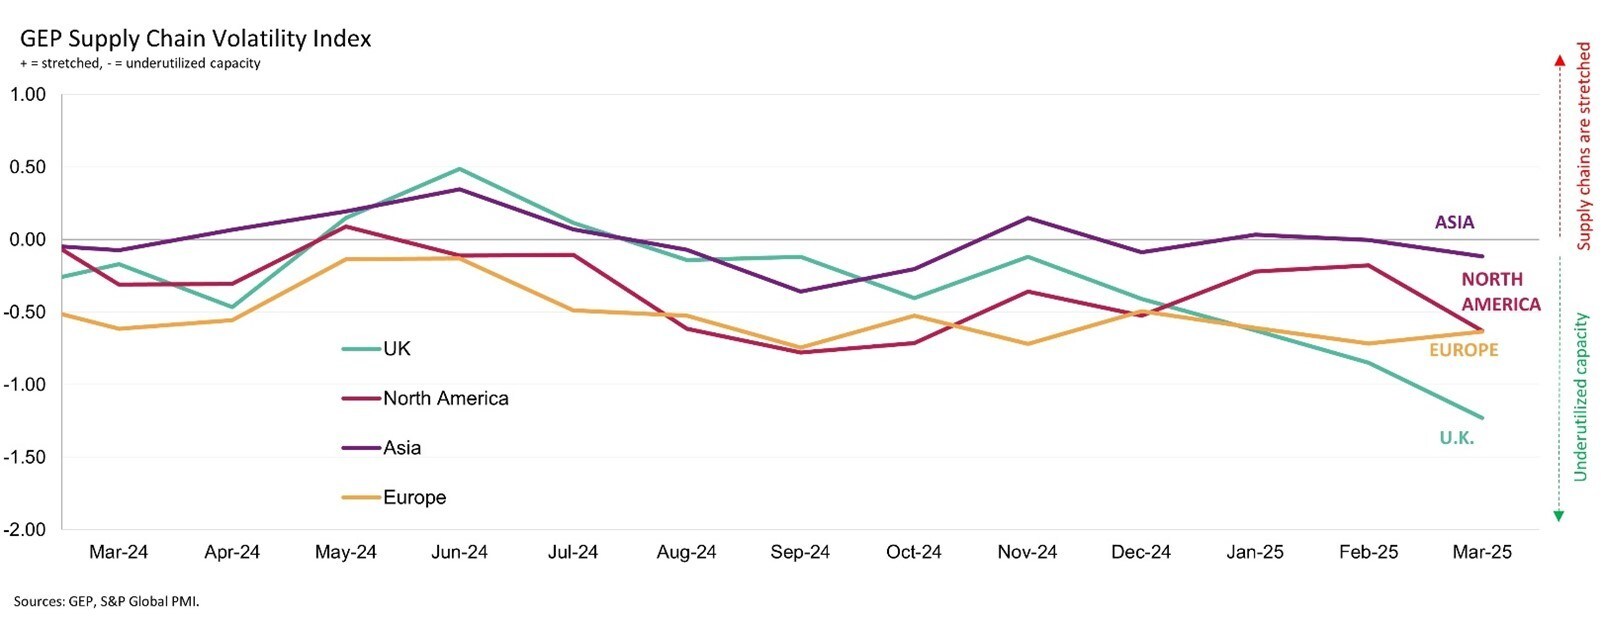
GEP Supply Chain Volatility Index
A key finding from GEP's latest data was a sharp decline in the number of companies building buffers into their stocks. Overall, manufacturers' stockpiling was the lowest in nine years, highlighting caution among procurement leaders worldwide about future demand.
"March's sharp decline in supplier activity was due to the stifling effect of tariffs and tariff-related uncertainty, which had its strongest impact in North America, where manufacturers reported cutbacks to purchasing activity and inventories," said John Piatek, vice president, consulting GEP. "Until just last week, most companies had taken a wait-and-see approach. Now, organizations are aggressively exploring every possible way to eliminate costs, push suppliers to absorb tariffs, and de-risk their global supply chains."
In the U.K., supplier spare capacity rose for the fourth month in succession to a level that has only been surpassed during either the COVID-19 pandemic or global financial crisis period. U.K. factories aggressively destocked and reduced spending during March, suggesting the country's industrial sector is bracing for a downturn.
Our data showed significant slack across European supply chains in March, although in contrast to the U.K., there were budding signs of recovery for the continent's industrial sector as demand for raw materials, commodities and components were down by the softest margin in almost three years.
Meanwhile in Asia, supply chains are broadly running at full capacity. In March, there was even a slight uptick in regional procurement activity, driven by China and India.
Interpreting the data:
Index > 50 means growth. The further above 50, the faster the growth
Index < 50 means decreasing. The further below 50, the larger the contraction.
MARCH 2025 KEY FINDINGS
- DEMAND: Our indicator, which tracks global demand for raw materials, components and commodities, was broadly unchanged during the month and therefore remained close to its long-term average, signaling global purchasing activity was near its historical trend. There remains considerable geographical differences, however, with a worsening of factory input demand in North America contrasting with some pick-up in Europe and Asia.
- INVENTORIES: Reports of safety stockpiling from manufacturers across the globe decreased in March to their lowest since July 2016 as procurement managers show a strong reluctance to add to their inventories. The data continues to point to the adoption of a "wait-and-see" mentality among buyers as uncertainty regarding worldwide trade conditions remains rife.
- MATERIAL SHORTAGES: Our global item shortages indicator, which tracks the availability of critical commodities, common inputs and components, remains below its long-term average, signaling robust global material supply levels. This metric implies that vendors have stock to meet orders from their customers.
- LABOR SHORTAGES: Reports of labor shortages remained contained. Companies are not struggling to process workloads due to staff capacity constraints, according to our backlogs tracker.
- TRANSPORTATION: Global transportation costs fell to their lowest in the year-to-date. Overall, they were close to their long-term average level in March.
REGIONAL SUPPLY CHAIN VOLATILITY
- NORTH AMERICA: Index at -0.63, down severely from -0.18, signaling a sharp rise in spare capacity across North American supply chains. U.S., Canadian and Mexican manufacturers retrenched in March.
- EUROPE: Index ticks up to -0.63, from -0.72, pointing to a still-high level of underutilization across European supply chains. Tentative signs of recovery emerge, however, as weakness in input demand recedes.
- U.K.: Index slumps to -1.23, a near five-year low, from -0.85, with U.K. procurement managers significantly reducing buying and inventories as the country's economy shows signs of slowing.
- ASIA: Index at -0.12, down from 0.00 in February. Overall, Asian supply chains are broadly operating at full capacity.
For more information, visit www.gep.com/volatility
What the stars mean:
★ Poor ★ ★ Promising ★★★ Good ★★★★ Very good ★★★★★ Exceptional
 Tag:
Tag:
Latest News
More News
- ABL Bio receives upfront payment and equity investment from Lilly (December 26, 2025 | 14:43)


 Mobile Version